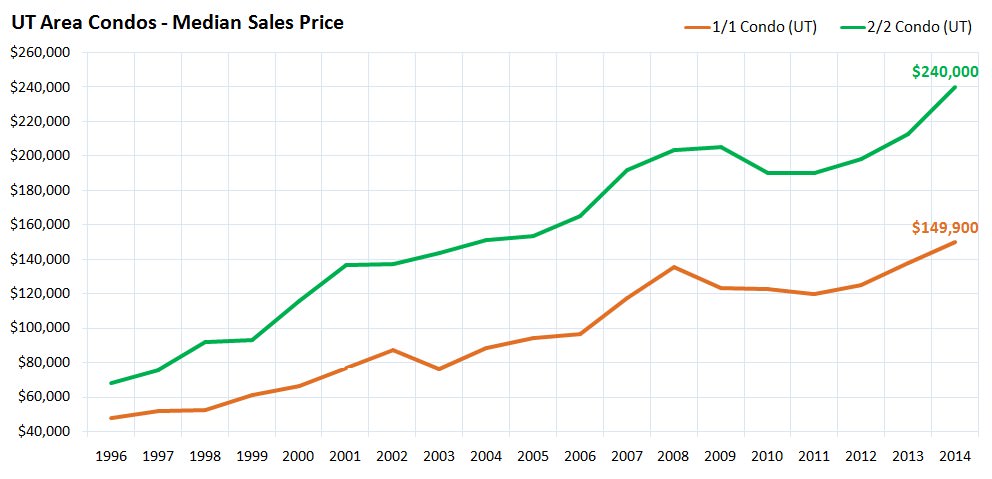
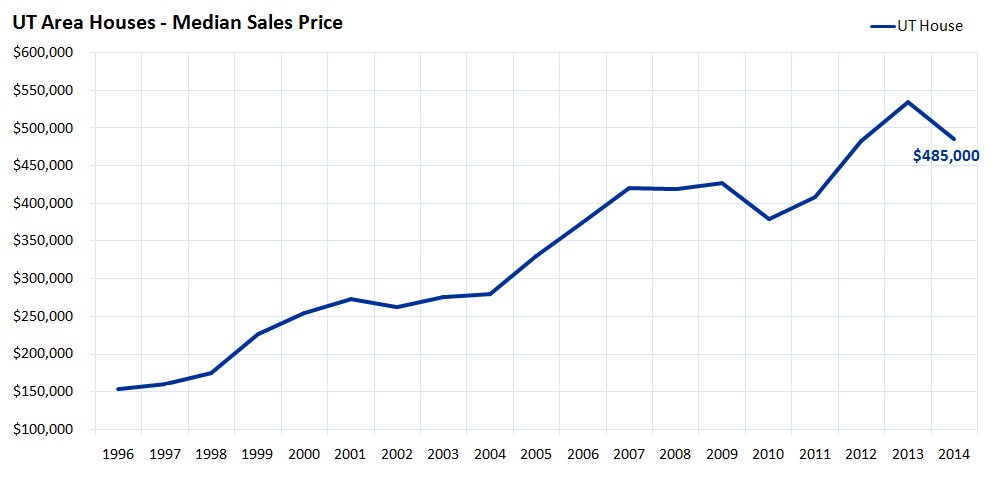
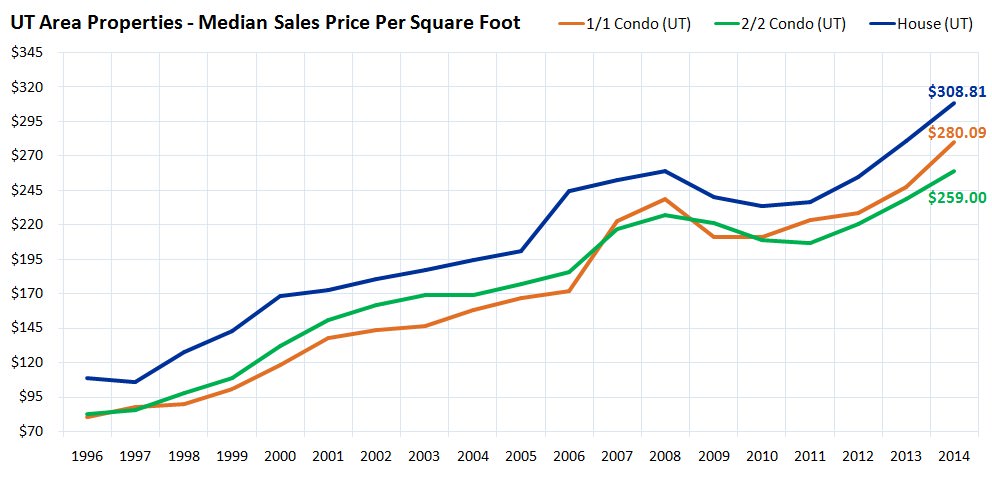
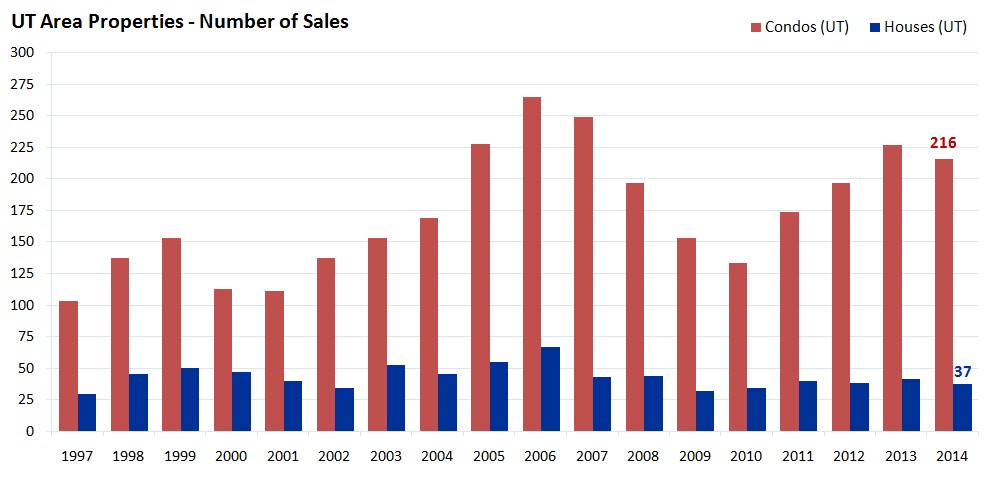
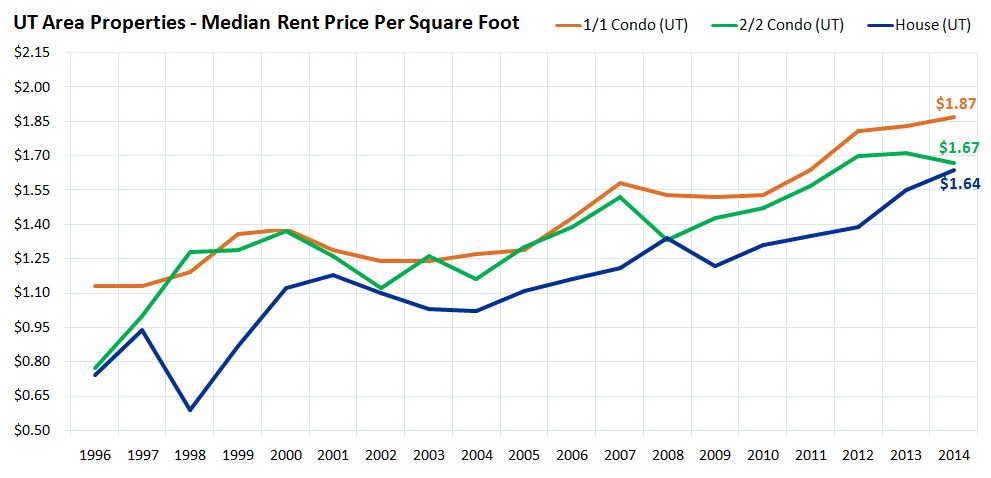
UT Austin Sales
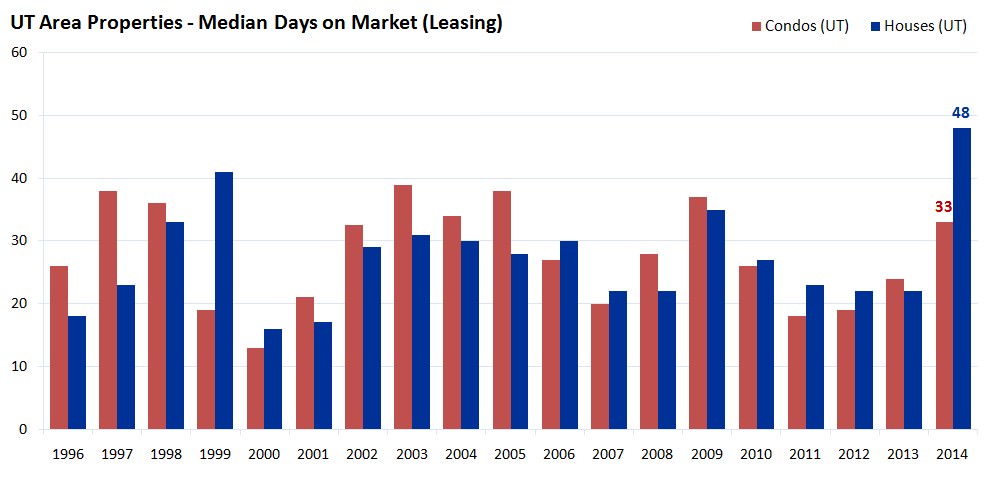
UT Austin Leasing
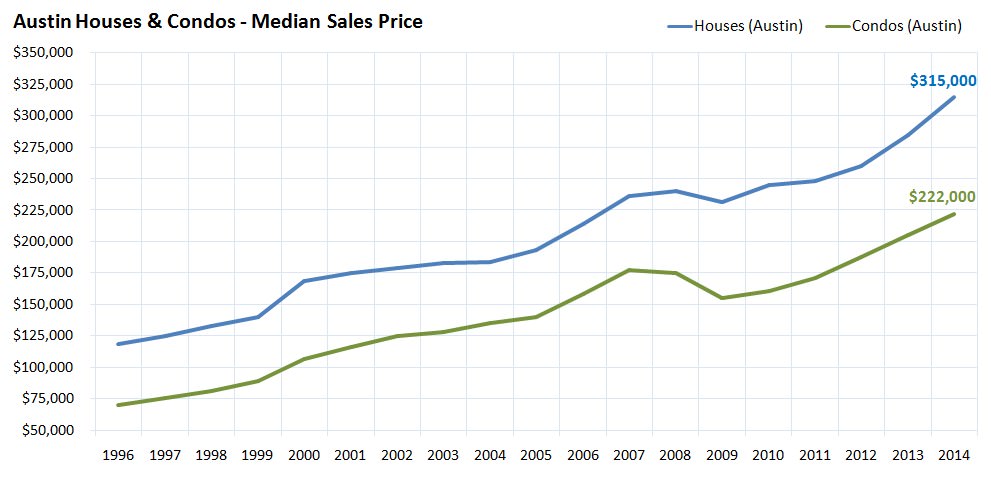
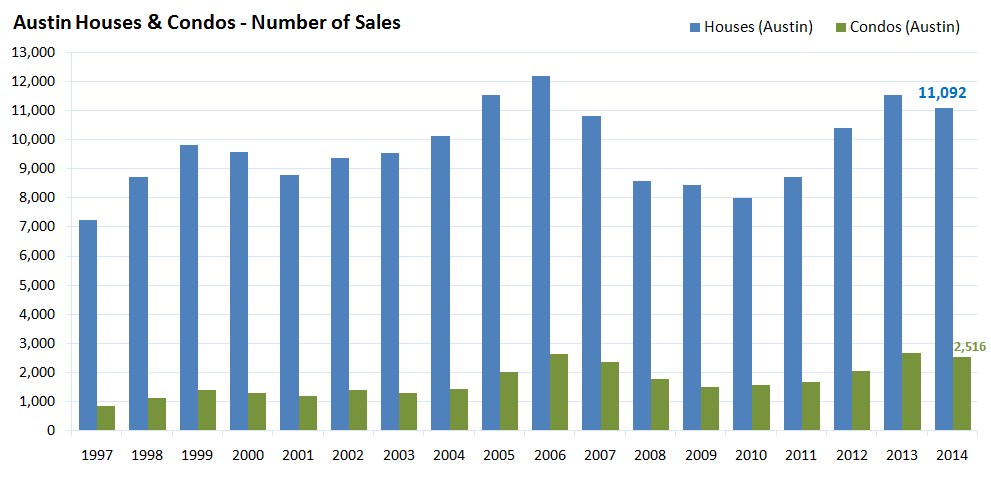
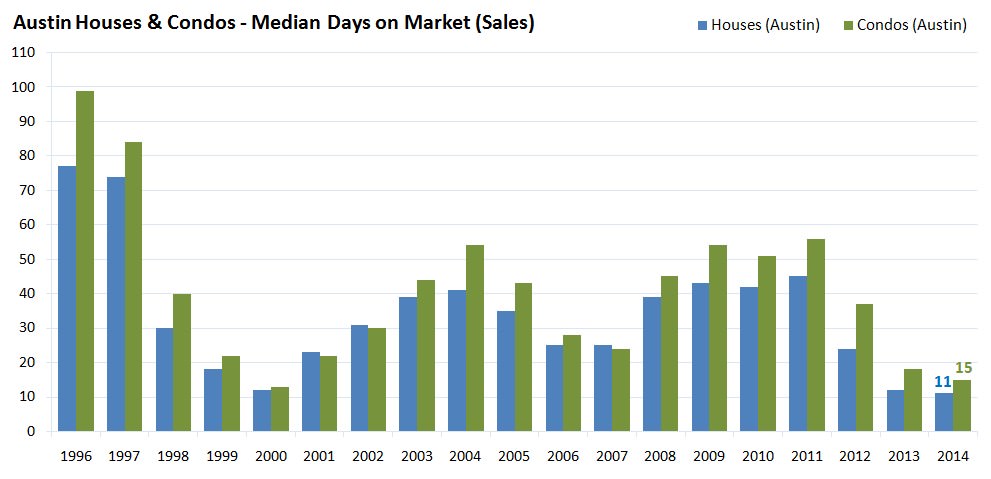
Austin Sales
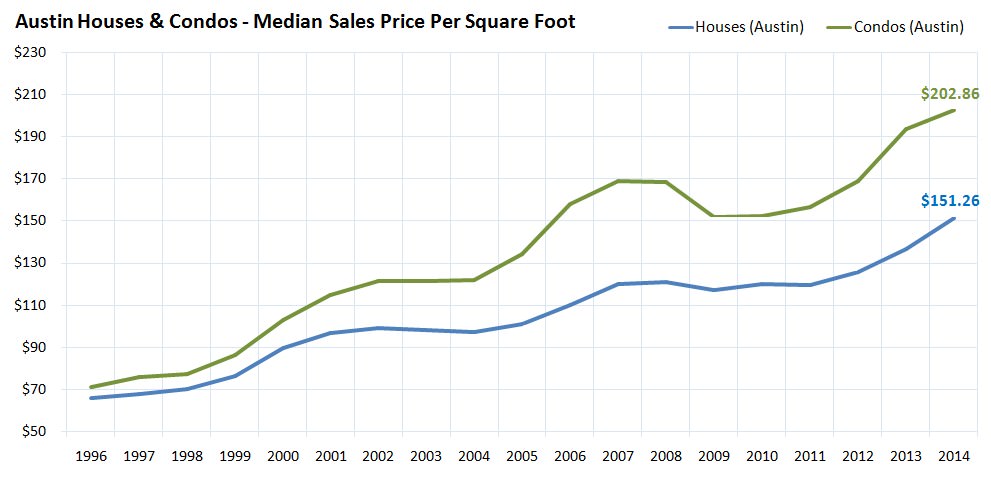
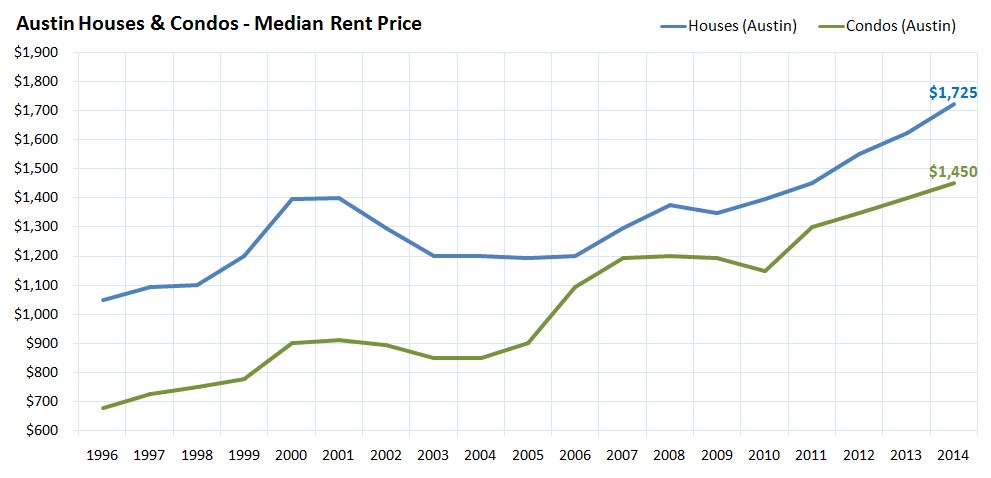
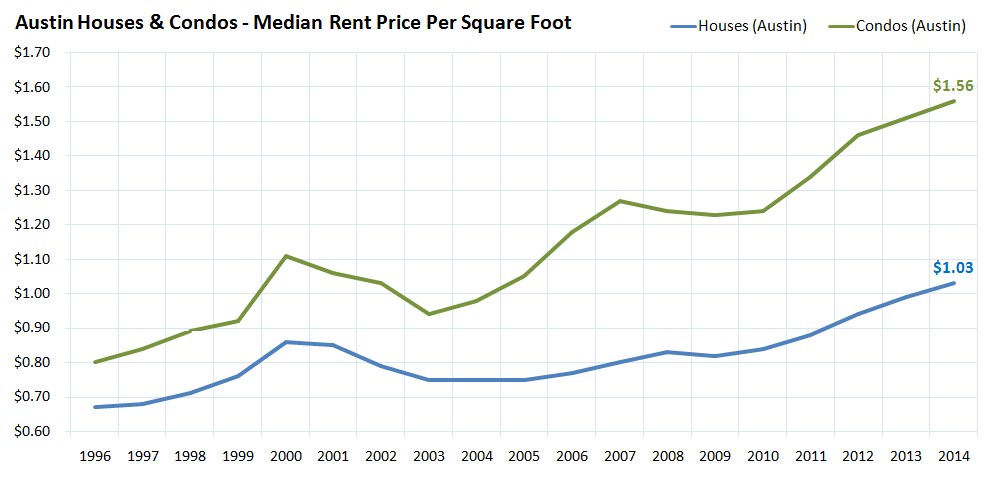
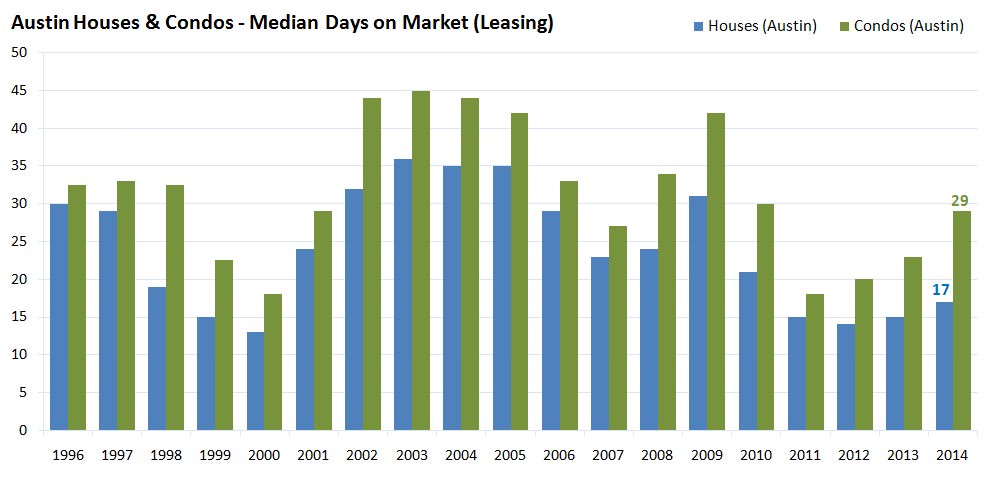
Austin Leasing
| Median Sales Price | Median Sales Price Per Square Foot | |
| UT 1/1 Condos (built in 1980s) | 5.9% | 6.6% |
| UT 2/2 Condos (built in 1980s) | 6.9% | 6.3% |
| UT Houses | 6.6% | 6.0% |
| Austin 1/1 Condos (built in 1980s) | 6.0% | 5.7% |
| Austin 2/2 Condos (built in 1980s) | 5.4% | 5.5% |
| Austin Houses | 5.6% | 4.7% |
| Austin Suburb Houses | 4.2% | 2.9% |